Tuesday, February 28, 2012

Following the Trend

By Scott Silva
Editor,  The Gold Speculator
2-28-12

Gold and silver are headed higher propelled by a powerful bull trend. Gold is climbing on its way to new multiyear highs, buoyed by massive government intervention in the capital markets. We will see gold exceed its 2011 highs this year. Silver will also soar to new highs.

What is behind this bullish prediction? Can we pinpoint the cause and effect relationship to the rise in the precious metals? Is now the time to buy gold and silver?

The answers to these questions come with a firm understanding of the dynamics of the business cycle, and the power of market trends. As we know from Mises and Hayek, interest rates have a profound effect on capital investment. Left to the free market, interest rates are determined by the supply of credit (a proxy for the savings rate) and investors’ willingness to risk placing capital in the market (a proxy of the return on capital). And as we know from Adam Smith, because investors act in their own self-interest, capital is allocated in free markets very efficiently. Investors tend to put more capital in “winners” and are quick to cut the losses in “losers”.

But if free markets are so efficient, how can there be downturns in the economy, ranging from recession to depression?  The cause of most economic downturns has been manipulation in the markets, typically by government agencies that seek to “manage” one or more segments of the economy by controlling interest rates, prices or both. Governments use coercion under the color of law to achieve their ends. Government intervention distorts natural interest rates and spoils price discovery, which leads to malinvestment and market bubbles. Downturns and displacement occur when economic bubbles burst.

The Federal Reserve has been one of the chief market manipulators. By setting interest rates and controlling the availability of credit and money, the Fed distorts the natural demand for money and credit, which obscures purposeful capital investment and contaminates prices for labor and commodities, often with disastrous results. When the Fed feeds artificial credit into the economy by lowering interest rates, it spurs investments in projects that eventually fail. The high-tech and dot com and housing manias all were fueled by decades of easy Fed money and credit. In each case these artificially induced booms collapsed with massive loss of wealth and devastation of the general economy.  

The data support the theory of cause and effect. The dot come run up coincided with a money supply run up which began in 1995. The money supply slightly flattened in 1996 and then zoomed up again in 1997, peaking at a 15% increase in January of 1999. The rate of increase began to fall precipitously thereafter, which popped the dot com bubble. The housing bubble, created by easy money and social engineering in the 1990’s popped in 2007, creating the Great Recession. The Fed and the Treasury added an unprecedented $2.3 Trillion to the money supply in 2008-2010 in the name of economic stimulus. The Fed’s MZM money supply measured $907 Billion in 1980 and is reported to be $10.8 Trillion as of this month.  The MZM does not reflect the $16 Trillion in bailout loans the Fed provided to large US banks in 2008-2011.  There is no doubt that judgments of investors and entrepreneurs are distorted by massive injections of money and credit by the Federal Reserve.


So what does easy money and credit from the central bank have to do with the price of gold?  Well, every Dollar the central bank creates out of thin air debases the value of Dollars already in circulation. That is the nature of fiat currency. Because gold is priced in Dollars, it takes more Dollars to buy the same amount of gold with every new weaker paper Dollar printed. We have seen the price of gold climb along with the money supply, accelerating its climb in 2002 coincident with the fall in the Dollar.


We are now seeing technical breakouts in gold and silver. Last week, gold broke out of a bullish head-and-shoulders pattern dating back to November 2011. The price target from this pattern is just over $2000/oz.  Silver followed last week, with a breakout from its own bullish head-and-shoulders pattern indicating a return to its September 2011 highs.

The trend in precious metals is up from here. Now is the time to buy gold, silver and selected gold and silver stocks.

Investors from around the world benefit from timely market analysis on gold and silver and portfolio recommendations contained in The Gold Speculator investment newsletter, which is based on the principles of free markets, private property, sound money and Austrian School economics.

The question for you to consider is how are you going to protect yourself from the vagaries of the fiat money and growing inflation?  We publish The Gold Speculator to help people make better decisions about their money. Our Model Conservative Portfolio has outperformed the Dow and the S&P 500 by more than 3:1. Subscribe at our web site www.thegoldspeculatorllc.com  with credit card or PayPal ($300/yr) or by sending your check for $290 ($10 cash discount) The Gold Speculator, 614 Nashua St. #142 Milford, NH 03055

Wednesday, February 22, 2012

Charting Gold

By Scott Silva
Editor,  The Gold Speculator
2-22-12

The charts are displaying new strength in gold and silver. We will see new highs in gold and silver this year. It’s not too late to buy the precious metals at bargain prices.

Technical analysis is a powerful tool for understanding the market for a traded good. Technical analysis employs time-tested techniques for predicting future price levels. The successful technical trader uses a combination of indicators to support the decision to take a long or short position in a given commodity. The planets are lining up in favor of another leg up in gold and silver. Let’s examine what the charts are telling us about gold today.

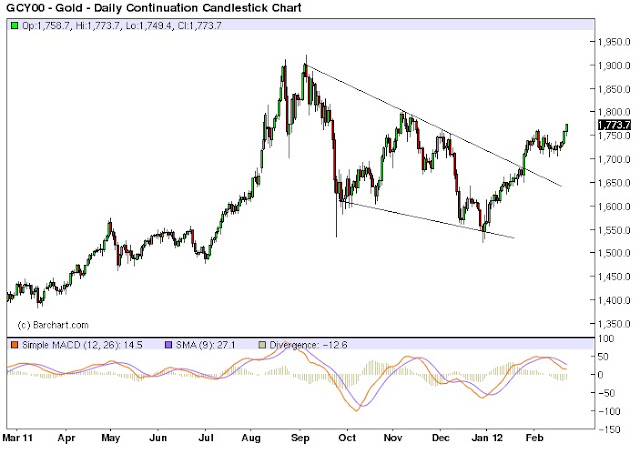
First, gold has broken out of a bullish falling wedge chart pattern dating back to September 2011.
The falling wedge pattern can be a continuation or a reversal pattern. It this case, it is a reversal pattern, signaling a reversal of an intermediate bearish trend. The falling wedge is a bullish pattern that begins wide at the top and narrows as prices gradually move lower. This price action forms an extended cone shape that slopes down as the reaction highs and reaction lows converge. The pattern is defined by the down-sloping upper resistance line and the lower, converging base support line.  The bullish breakout occurs when price action closes above the resistance line (upper descending tend line) with confirming volume. The point count for the pattern is calculated by adding the magnitude at the widest span to the price at breakout.


We can see the falling wedge reversal pattern in the daily basis chart for April COMEX gold above. The intermediate bearish trend began in early September 2011. The price at the break above the resistance line was 1674.40.  The point count is 321 which sets the price target at $1995/oz.  The breakout is confirmed by significant volume at the breakout day, January 25th.

We can see the same breakout in gold using Ichimoku Kinko Hyo indicators.


Here we see spot gold on a daily basis with Ichimoku indicators. The January 25 breakout above resistance on higher volume is highlighted in the oval. Today’s chart shows all Ichimoku indicators are bullish for gold. Price action is above the cloud, which is bullish. The Tenkan Sen made a bullish cross (from below) the Kijun Sen back on January 17th. The projected cloud is bullish (shaded green).  And the Chikou Span is well above price action and above the cloud, which is a strong bullish signal.

Silver is displaying similar bullish patterns and indicators. So are selected gold and silver stocks.
Now is the time to own gold and silver.

Investors from around the world benefit from timely market analysis on gold and silver and portfolio recommendations contained in The Gold Speculator investment newsletter, which is based on the principles of free markets, private property, sound money and Austrian School economics.

The question for you to consider is how are you going to protect yourself from the vagaries of the fiat money and growing inflation?  We publish The Gold Speculator to help people make better decisions about their money. Our Model Conservative Portfolio has outperformed the Dow and the S&P 500 by more than 3:1. Subscribe at our web site www.thegoldspeculatorllc.com  with credit card or PayPal ($300/yr) or by sending your check for $290 ($10 cash discount) The Gold Speculator, 614 Nashua St. #142 Milford, NH 03055

Tuesday, February 14, 2012

Trading Above the Clouds

By Scott Silva
Editor,  The Gold Speculator
2-14-12

Technical analysis is replete with analytic tools, techniques and systems all designed to provide insight into the future price movement for a traded security. The technician relies on price and volume history to predict future outcomes. Can looking at the past be a reliable guide to divining the future? Can anyone drive a car by looking only at the review mirror? Amazingly, in trading securities, the answer is yes.

This is because the markets for stocks, bonds, commodities and virtually any traded good is driven by human behavior. In the search for profit, buyers and sellers act in their own self interest. The buyer always buys at a discount to his perception of the security’s value. Likewise, the seller always sells when he perceives value is realized, or his capital is better used elsewhere. When a transaction occurs, the buyer and the seller each believe they have struck a bargain at the mutually agreed sum. As Adam Smith instructs us, this is the magic of price in a free market.

So how does price history guide the investor? Well, it turns out that price movements develop distinctive patterns of human behavior in the markets. When a stock or commodity is considered undervalued, the buyers step in, bidding the price up. Likewise, when prospects for the commodity diminish, then sellers rule. It the dynamic pressure between sellers and buyers over time that creates the peaks and valleys we see depicted in the charts. Price history creates repeatable patterns. Understanding chart patterns is the key to predicting future price action.

You have seen in these pages before, I believe one of the best analytic tools for predicting future commodity prices is Ichimoku Kinko Hyo. It provides “equilibrium at a glance”- all we need to know about the state of the traded good as well as its likely future price. Let’s examine gold using Ichimoku Kinko Hyo, to see if we should buy sell or hold gold today.

Here is the Ichimoku chart for spot gold. Most trading platforms and chart services include this indicator set. I use the Thinkorswim trading platform from TD Ameritrade. It provides excellent technical analysis tools and Level II access to stock, option and commodity futures markets in a single, integrated platform.


We can see immediately that gold is in a bullish trend on the daily basis. The Ichimoku Kinko Hyo chart feature that signals the bullish state is price action above the cloud (“moku” in Japanese) represented by the pink and green shaded areas. (Conversely, if price action were below the cloud, the trend would be bearish). The cloud represents support and resistance levels. It is constructed by traces of two leading lines, known as the Senkou Span A, and the Senkou Span B. Together they form the complete view of longer-term support and resistance. One of the kumo's most unique aspects is its ability to provide a more reliable view of support and resistance than that provided by other charting systems. Rather than providing a single level for support and resistance, the kumo expands and contracts with historical price action to give a multi-dimensional view. Also, the kumo projects support and resistance levels into the future.  We can see the cloud is projected into the future, and that in early March, the cloud changes color form pink to green. This reversal is a bullish indicator. Without the cloud predicted cloud reversal, we would not make a long trade today. The projected cloud tells us that resistance level changes to 1710.89 (top of the projected green moku) and support is 1645.50.

The next set of Ichimoku indicators important to our trading decision is the relation of the Tenkan Sen (blue line) to the Kijun Sen (red line). These are trend lines, similar to short-term and longer-term moving averages. A strong buy signal occurs when the Tenkan Sen crosses above the Kijun Sen from below. A strong sell signal occurs when the Tenkan Sen crosses from above. We can see the Tenkan Sen made a bullish cross on January 17th when gold opened at 1635.80. Together with the price action/kumo bullish indicator, the bullish projected kumo indicator, the bullish cross by the Tenkan Sen remains intact, so we are not prohibited from taking a long position as yet. We are close to deciding, however.

The last an perhaps the most important Ichimoku indicator we need to check is the Chikou Span (green line) in relation to price action and the kumo. The Chikou Span is current price projected back 26 periods. The Chikou Span gauges the strength of the current trend. The bullish trend is strong when the Chikou Span is above price action and above the cloud. The bearish trend is strong when the Chikou Span is below price action and below the cloud. The trend is neutral or week when the Chikou Span touches prices action or is in the cloud. We can see that the Chikou Span is above price action and above the cloud for gold, another bullish signal.

Together, the five Ichimoku indicators show gold to be in a bullish trend. Ichimoku trading rules all indicate it’s safe to enter a long position in gold today, or to hold a long position in a portfolio.

The Ichimoku indicators tell me it’s safe to buy silver at today’s prices as well.


Trading precious metals above the clouds using Ichimoku indicators is an excellent way to increase the value of your portfolio.

Investors from around the world benefit from timely market analysis on gold and silver and portfolio recommendations contained in The Gold Speculator investment newsletter, which is based on the principles of free markets, private property, sound money and Austrian School economics.

The question for you to consider is how are you going to protect yourself from the vagaries of the fiat money and economic uncertainty?  We publish The Gold Speculator to help people make better decisions about their money. Our Model Conservative Portfolio has outperformed the DJIA and the S&P 500 by more than 3:1 over the last several years. Subscribe at our web site www.thegoldspeculatorllc.com  with credit card or PayPal ($300/yr) or by sending your check for $290 ($10 cash discount) The Gold Speculator, 614 Nashua St. #142 Milford, NH 03055
Tuesday, February 7, 2012

By the Numbers

By Scott Silva
Editor,  The Gold Speculator
2-7-12

We all know that numbers don’t lie. Numbers are objective. There is nothing that numbers do except represent some value. In this sense, mathematics is pure, and therefore reliable and repeatable. Mathematics is one of the foundations of science. Physics is nature expressed in numbers. The world has come to respect numbers. From ancient weights and measurements, to architecture, chemistry, astronomy, agriculture, engineering, trade and commerce, and many other human endeavors, numbers provide universal understanding of every aspect our existence on the planet.

The Federal government, however, has trouble with some numbers. When numbers don’t represent its policy, agenda or campaign strategy, then the administration changes the numbers. They manipulate the numbers. They “smooth” the numbers. They ignore the offensive numbers. They even make up their own numbers. They outright lie about the numbers.

This is the case of the most recent US unemployment numbers.

Friday, the stock market jumped and gold declined on the release of January jobs and unemployment data from the US Labor Department’s Bureau of Labor Statistics (BLS). The government reported that 234,000 new jobs were added in January, bringing down the national unemployment rate to 8.3%.
This would be great news...if it were true. But the BLS is not reporting the actual unemployment rate. If the BLS reported truthfully, the headline unemployment rate would be 11% for January, much worse than the number reported, and certainly not a continuing upward trend. This is an intentional deception, motivated the  
administration's re-election campaign strategy.

 Here’s why the true unemployment rate is grossly understated. The January data does not account for 1.2 million qualified workers who dropped out of the job market last month. This is the largest monthly reduction in the available workforce by the dropout of  “discouraged” workers ever.  The labor participation rate declined to 63.7% in January, down from 65.7% when the president took office. Many qualified workers have simply quit looking for jobs. When the BLS ignores them, the U-3 unemployment rate appears to improve. The broader, U-6 measure of unemployment which includes the discouraged plus underemployed part-time workers is 15.1%.  Quite a difference. 


We have not seen US unemployment at these high rates since the Great Depression.


It is clear from the U-6 numbers that the employment situation is declining, not improving. It’s fair to say that based on the high unemployment rate, the administration’s economic policies have clearly failed. It’s no wonder that the economy continues to lag. US GDP growth is forecast to decline further in 2012. Clearly, the US has not turned the corner in its economic recovery. The BLS uses the “discouraged worker” data in a deceptive way in an attempt to paint a rosy picture of an improving economic recovery. This is not the first deceptive BLS report. The BLS has been understating unemployment since the president was inaugurated. So the BLS reports are fake-a snare and a delusion. The mainstream media picked up on the January bogus report as if it were real; stocks jumped and the president took immediate credit over the airways. What a travesty!

Well, not everyone is fooled by the bogus BLS report. Several knowledgeable sources have spoken out including the editorial staff of the Washington Times, FOX News and Larry Kudlow, to name a few. The Congressional Budget Office also sees things differently than the administration’s spin machine. The non-partisan CBO is forecasting unemployment at 8.3% for 2012 and 9.2% for 2013. That’s not a positive trend.

Bogus BLS unemployment reports affect the markets. They give an artificial boost to stocks, and impact gold and silver prices. Because the truth will eventually emerge, and because there remain fundamental risks in the European debt crisis and increasing threats to stability from Iran and Syria, gold and silver have not collapsed. In fact, the pullbacks in gold and silver present new buying opportunities.

Today, gold is telling us that it is not fooled by the bogus jobs report. Gold is headed up again, continuing its breakout from a bullish falling wedge chart pattern. There are several technical indicators that we see calling for gold to retest the $1900/oz level over the next few months.


The price of gold is one of the numbers we can appreciate.

Investors from around the world benefit from timely market analysis on gold and silver and portfolio recommendations contained in The Gold Speculator investment newsletter, which is based on the principles of free markets, private property, sound money and Austrian School economics.

The question for you to consider is how are you going to protect yourself from the vagaries of the fiat money and economic uncertainty?  We publish The Gold Speculator to help people make better decisions about their money. Our Model Conservative Portfolio has outperformed the DJIA and the S&P 500 by more than 3:1 over the last several years. Subscribe at our web site www.thegoldspeculatorllc.com  with credit card or PayPal ($300/yr) or by sending your check for $290 ($10 cash discount) The Gold Speculator, 614 Nashua St. #142 Milford, NH 03055

Fiat Empire; Why the Federal Reserve Violates the U.S

Barney Frank DNK Freddie/Fannie

The Fall of the Republic