Tuesday, July 24, 2012

How Bad Can it Get?

By Scott Silva
7-24-12

How Bad Can It Get?

Well, that’s the question that the central planners need to answer, but not one seems ready to admit the fact that the US economy is slowing down further despite the rosy outlook of presidential re-election cast of characters, which includes most of the media. Those stubborn facts remain: unemployment is climbing, not declining; consumer sales are down; corporate capital expenditure (CAPEX) is down; energy prices are headed up; food prices are headed up; real wages are down; housing prices are still down; real interest rates are negative; national debt is growing; and GDP is slowing.

So what’s the bad news? The bad news is we are hurdling toward the fiscal cliff, Thelma and Louise-style, with POTUS and Big Ben Bernanke holding hands in their blue ‘66 Thunderbird convertible as it plummets to the canyon floor below. The sad fact is there is a leadership vacuum in Washington, which prevents rational bipartisan decision-making regarding deficit reduction and spending priorities. If the debt limit fiasco of last August is any measure of dysfunction by the Federal government, then stand by for the real fireworks  display as the Super Committee cuts kick in, the Bush tax cuts expire (for every taxpayer), and the Obamatax takes hold.

Each one of these Federal bipartisan compromise measures will decimate jobs and grind growth to a standstill. A recent study concludes that the automatic spending cuts mandated in the Budget Control Act of 2011 affecting defense and non-defense discretionary spending in just the first year of implementation will reduce the nation’s GDP by $215 billion; decrease personal earnings of the workforce by $109.4 billion and cost the U.S. economy 2.14 million jobs.

That’s no way to stimulate the economy, which is exactly what Fed Chairman Bernanke told House and Senate Finance Committees last week. The Chairman’s remarks painted a pretty gloomy picture for US economic growth, and he repeatedly pointed to fiscal policy (outside his control) as a major culprit. The markets were hoping he would announce the start of QE3, but Big Ben could only reiterate that the “Fed stands ready to act…when conditions require…”  Oh well, Ben and boys will have another chance to make the big announcement when the FOMC meets again Jul 29-Aug 1. Chances are the Wisemen will offer nothing earthshaking after their regular pow-wow.

The markets are searching for a reason to climb, but the threat of extended recession in the US, deepening recession in Europe and a slowdown in China all work against any sustained move. Sideways motion seems to be the trend. Something has to change before investors decide to pour capital into risk-on asset classes. Many are happy to stay in Treasurys and precious metals until there is some light ahead, which is why stocks have taken such a beating this year, and prices of T-Bonds and gold are maintaining their prices.

What are the technical indicators telling us about gold now?  We can use technical pattern analysis and the more complete Ichimoku Kinko Hyo indicators to examine trading decisions for gold.

Gold has formed a symmetric triangle pattern evident on the daily basis chart. Symmetric triangle patterns typically form during a trend as a continuation pattern. The pattern contains at least two lower highs and two higher lows. When these points are connected, the lines converge as they are extended and the symmetrical triangle takes shape. The pattern shape appears as a contracting wedge, wide at the beginning and narrowing over time.

Symmetrical triangles can mark important trend reversals. They can also mark a continuation of the current trend. Whether signaling a continuation or a reversal, the direction of the next major move can only be determined after a valid breakout.  A “breakout” of the pattern occurs when the closing price is above or below the narrowing pattern lines. Therefore, the breakout can be to the upside or the downside. Determining a valid breakout can be challenging; price action can return to the breakout point creating a false breakout. Increased trading volume concurrent to the breakout is a reliable confirmation indicator. Other useful confirming indicators include proof of a 3% move above the pattern line and the time-based rule, such as a sustained move over three days.

To determine the price target for a breakout from a symmetric triangle pattern, we can either measure the widest distance of the symmetrical triangle pattern and apply it to the breakout point, or we can draw a trend line parallel to the pattern's trend line that slopes (up or down) in the direction of the break. The extension of this line will mark a potential breakout price target.

Today, price action is between the pattern lines whose breakout values are 1612 on the upside and 1559 on the downside. If price action slides sideways from here, the breakout values converge, creating more opportunity for a breakout without a substantial change in price. For example, if we project sideways movement to August 16th, then the breakout values narrow to 1598 and 1571.  The depth of the triangle sets the price increment at 72 points.

The Ichimoku Kinko Hyo indicators confirm these support and resistance values of the symmetric triangle pattern above. The cloud or moku is the shaded area on the Ichimoku indicators chart below. The cloud depicts support and resistance levels and can be projected forward. For gold, the projected cloud is narrowing. Also, the projected cloud top is flat, which portend sideways movement. The support and resistance levels for the projected cloud out at August 17th are 1598 and 1590.


The Ichimoku indicators tell us more about price gold than the triangle pattern. Ichimoku, the “one look equilibrium chart”, gives us not only support and resistance, but trends, momentum, and trend reversals in a single, coherent view of its five price-related indicators. Professional traders use Ichimoku indicators to trade currencies, futures, stocks and bonds successfully by tapping into to strong trends. There are well established rules for trading using Ichimoku Kinko Hyo, which we use at The Gold Speculator. Right now these indicators signal “hold” for those that own gold. These same indicators will tell us when the time is right to “Buy” or “Sell” to take full advantage of the new intermediate trend for gold.

So no matter how bad the economy gets, we can stay ahead of the pack by trading hard assets, such as gold.

Responsible citizens and prudent investors protect themselves and their wealth against the ambitions of over-reaching government authority and debasement of the currency by owning gold. Gold is honest money. Investors from around the world benefit from timely market analysis on gold and silver and portfolio recommendations contained in The Gold Speculator investment newsletter, which is based on the principles of free markets, private property, sound money and Austrian School economics.

The question for you to consider is how are you going to protect yourself from the vagaries of the fiat money and economic uncertainty?  We publish The Gold Speculator to help people make better decisions about their money. Our Model Conservative Portfolio has outperformed the DJIA and the S&P 500 by more than 3:1 over the last several years. Follow @TheGoldSpec   Subscribe at our web site www.thegoldspeculatorllc.com  with credit card or PayPal ($300/yr) or by sending your check for $290 ($10 cash discount) The Gold Speculator, 614 Nashua St. #142 Milford, NH 03055

Tuesday, June 26, 2012

Greed is good.

By Scott Silva
6-26-12

“Greed, for lack of a better word, is good.” So said Gordon Gekko, the iconic corporate raider in Oliver Stone’s cynical 1987 film Wall Street.  Michael Douglas won an Academy Award for Best Actor for his role in the film, now a classic. In the film, Gekko is ultimately imprisoned for securities fraud after years of benefiting from insider trading.  Today, many liberal legislators and left-wing politicians associate Wall Street traders and investment bankers with the criminal activities of Gordon Gekko, the fictional film character. Certainly the Occupy Wall Street protesters believe Wall Street is the seat of corporate greed and corruption.  Some US Senators conflate securities fraud with speculation, frequently referring to Gordon Gekko, excess and greed in speeches designed to vilify speculators, who after all, “caused the financial meltdown” or, “caused $5.00/gal gasoline prices” with their wonton, unbridled greed.

But speculation in the commodities markets is not illegal. Nor is it immoral. In fact, speculation is integral to operation of free markets. There is a legitimate role for market speculation in efficient markets. Without market speculation, prices would be less stable and price discovery more difficult, making markets less efficient.  For example, if there were no speculators in the pork bellies market, the market would consist of producers (hog farmers) and consumers (butchers, and those who prefer to carve up their meat themselves).  With just two participants in the market, the market would be thinly traded, leading to large spreads between bid and asked, which distorts prices, and makes capital investment less efficient.  As a market participant, the speculator adds liquidity (risks his own capital) and provided a competitive bid which narrows the spread, making the market more efficient for all participants. Because there are two sides to a speculative trade, either the long position holder or the short position holder will benefit from price changes over time.

Usually, speculation in a particular market has a dampening effect on price volatility, but there have been periods of “irrational exuberance” where prices are bid up in exponential fashion, creating a market bubble.  Speculators may participate in the development of a market bubble, as they did in the real estate market boom of 2000-2008, but it takes more than speculation to cause a market bubble. In the case of the US real estate bubble that burst in 2008, decades of easy money and government intervention in the home mortgage industry via the Community Reinvestment Act laid the foundation for the irrational boom and its ultimate bust.

Recently, speculation has been blamed for high gasoline prices. “The oil speculators have bid up the price of oil, so you are now paying $5.00 per gallon at the pump!” complained a US Senator who proposes to ban speculators from trading oil futures. “Only producers and commercial consumers who need to hedge should be allowed to trade oil futures contracts,” say proponents of strict regulation of the oil futures markets; “Speculators are greedy, and greed is bad.”  But studies show that oil prices have increased steadily since 2000, with commercial and non-commercial (speculators) holding net long into the extended bull market for oil. Even during the period of strict regulation and position limits on the commodities futures market, prior to the Commodities Futures Modernization Act, oil prices tended to climb higher year after year.

Although speculators have represented a growing percentage of open interest since 2003, the Commodities Futures Trading Commission (CFTC) concluded in its own investigation of the oil futures market that there is no evidence that the market was influenced by the trading behaviors of any large group of participants. In fact, CFTC chairman Walter Lukken told a committee of the U.S. House of Representatives in 2008 that CFTC analysis “did not find  direct  evidence  that  speculation  was  driving  up  (commodity)  prices.” The fact is, global the oil market was tight, leading to the peak price of WTI at $147/bbl in mid 2008.  The futures price was a prescient leading indicator.

If speculators did not cause the bubble in the oil market, what did? One explanation that makes sense is the weakening Dollar. Because oil futures settle in Dollars (or physical delivery), it takes more Dollars to buy a barrel of oil, for a given supply, when the Dollar is weak. Conversely, the stronger Dollar purchases more barrels per Dollar, driving down the price in the global market. The value of the Dollar has been trending down ever since the Federal Reserve has been printing more of the stuff in the name of US economic stimulus. It is the time-tested economic principle known as Gresham’s Law that bad money drives out good. Printing more money out of thin air debases the currency and devalues Dollars in circulation. 

We can see the inverse relationship of oil (West Texas Intermediate, WTI) and the US Dollar Index (USD) in the chart below. WTI peaked just as the US Dollar bottomed in 2008 just as the Federal Reserve added the first $700 Billion of the $3 Trillion it would add to its balance sheet under its economic stimulus policy. The anticipated effect of spurring the economy into robust recovery has proved elusive. But there are unintended negative consequences of the Fed’s money printing spree, which include higher prices for commodities.  As we know from Milton Freidman and the recently departed Anna Schwartz, may she rest in peace, inflation is always and everywhere a monetary phenomenon.


We also know that the price of gold reflects the strength of the Dollar. The Dollar’s drift from 2002 to 2008 helped propel the price of gold up over $1200/oz. Of course, there are other factors that contribute to gold’s rise. Gold is the traditional safe-haven asset that investors seek out in times of economic uncertainly, turmoil and war. Gold has intrinsic value, and it acts as a store of value. Unlike fiat currency, gold maintains its value and is recognized as viable collateral for transactions in markets around the world.

Today, oil prices have subsided a bit from the highs of over $110/bbl earlier this year. WTI is now trading down below $80/bbl with no added supply. Some analysts believe that the war premium has been wrung out of the price. Iran is no longer openly threatening to close the Strait of Hormuz. Maybe so, but the primary cause is softer demand.  Double dip recession in Europe, a slowdown in China and the continuing slow-motion, no-growth, jobless recovery in the US has dampened demand for energy. And by the way, the Large Speculators have been cutting back their long positions on WTI and adding short positions; last week’s Commitment of Traders report showed bullish sentiment for oil has dropped to 63% down from 96% in February when WTI was trading near $110/bbl.  No one seems to complain about speculators when prices go down.

Gold is also trading below $1600/oz.  But more poor US economic data is coming for sure, and the Fed will jump in with more quantitative easing, adding more to its balance sheet which will further devalue the currency. So, in today’s market, take a page from Gordon Gekko’s playbook. Buy, buy, buy gold. Because, as we all know, “Greed is good.”

Responsible citizens and prudent investors protect themselves and their wealth against the ambitions of over-reaching government authority and debasement of the currency by owning gold. Gold is honest money. Investors from around the world benefit from timely market analysis on gold and silver and portfolio recommendations contained in The Gold Speculator investment newsletter, which is based on the principles of free markets, private property, sound money and Austrian School economics.

The question for you to consider is how are you going to protect yourself from the vagaries of the fiat money and economic uncertainty?  We publish The Gold Speculator to help people make better decisions about their money. Our Model Conservative Portfolio has outperformed the DJIA and the S&P 500 by more than 3:1 over the last several years. Follow @TheGoldSpec   Subscribe at our web site www.thegoldspeculatorllc.com  with credit card or PayPal ($300/yr) or by sending your check for $290 ($10 cash discount) The Gold Speculator, 614 Nashua St. #142 Milford, NH 03055

Tuesday, June 12, 2012

Eurobomb Ticking Down, II

By Scott Silva
6-5-12

Last January, we warned readers of these pages of the “Eurobomb Ticking Down”, which forecast financial chaos across the Eurozone would come as the result of continued deficit spending, massive accumulated sovereign debt and growth of entitlement program spending to unsustainable levels. http://www.kitco.com/ind/Silva/jan182012.html

Today, the G7 is holding emergency meetings to deal with the imminent collapse of Spanish sovereign debt in the bond markets, even as Germany considers funding a bailout package for Spain, or possibly changing its position in favor of the Eurobond solution to the regional banking crisis. As Papa Hemingway emmingwayHewonce observed, bankruptcy happens two ways, “Gradually, then suddenly.”  Today, Treasury minister Cristobal Montoro said that at current borrowing costs financial markets were shut to Spain. If the bond market were suddenly no longer available to Spain as it struggles to refinance its debt, without restructuring, Spain’s financial system would collapse, pushing its battered economy further into recession, then likely, depression. Already, one in four is out of work in Spain. Yet the government is unwilling to accept terms of any EU rescue plan.

Greece is faring no better.  Standard & Poor's announced today there is 1/3 chance that Greece will exit the Eurozone in the coming months, following the elections on June 17th. The credit agency further stated a Greek exit would “seriously damage Greece's economy and fiscal position in the medium term and most likely lead to another Greek sovereign default.” Another Greek default would impact other Eurozone economies which would also face credit rating write- downs-- a vicious downward spiral.

The emergency conference call of G7 members today is not likely to result in immediate action. The G20 is scheduled to meet June 18-19, immediately following elections in Greece. A major topic will be the path to financial stability for the Eurozone. All G20 members, including the US and China have a stake in the summit outcome.

But the bond market is not shutting Spain out.  At least not yet. Yields for Spanish 10-year notes are coming down in today’s trading. Apparently, the bond vigilantes did not get the Montoro memo. Although rates for Spanish 10-year note have risen steadily and approached the 7% danger zone leading up to the G7 meeting, yields declined 1.3 basis points to 6.4% in today’s trading. The market is discounting a coordinated effort by the ECB, EU and the IMF to stabilize the Eurozone and keep it intact. Last week, the EU offered to extend the deadline a year to 2014 for Spain to bring its deficit down to the EU limit of 3% of GDP. The Commission has also suggested that the ESM could provide direct funding to Spain, although that measure would require a change to the existing treaty and ratification by all 27 members. Even if these life-line measures were adopted, they may prove only to delay inevitable default.

Some near term relief may come from the ECB. Many analysts expect the ECB to cut its refi rate below its current 1% level within the next few weeks. A near-zero interest rate policy would ease pressure on those countries most in need of cheap refinancing. The ECB could also opt for another injection of liquidity into the entire region via long-term refinancing operations (LTROs), or some old fashioned bond-buying.  But these steps would also firmly establish a liquidity trap in which no amount of added liquidity to the banking system provides marginal output.  This is the problem with the Keynesian obsession with too much money. It is simply impossible to print your way to prosperity with more and more fiat currency. But that is precisely what progressive central bankers tend to do when facing an economic downturn.  Apparently, the urge to ease is powerful and overwhelming.

But intervention fails. It has always failed. And it will always fail. Fed intervention failed to reverse the economic slide in the 1930’s. In fact, according to Friedman and Schwartz, Federal Reserve actions deepened and extended the Great Recession. Today, near-zero interest rate and quantitative easing by the US central bank has failed to reverse the economic slide of the Great Recession. And the ECB has failed to ignite any economic recovery in the Eurozone. For example, the leading European economies, Germany, France, Italy and Spain account for 77 per cent of total Eurozone GDP, but in the past four quarters, Germany posted average quarter-over-quarter growth of 0.3 per cent, yielding an annualized rate of expansion of just1.2%, while most of Europe remains in recession.  France posted average quarterly growth of just 0.1 per cent in the year up to April, an annualized rate of expansion of just 0.4 per cent. France recorded zero quarterly growth in 1Q2012. Spain and Italy have been a drain. Spain is officially in recession with an average quarter-on-quarter decline of 0.1 per cent since the second quarter of 2011.  Italy is in its third consecutive quarter of negative growth, with an average quarterly rate of minus 0.35 per cent over the year to April 1.  Utterly underwhelming.

So what does the continuing saga of the Eurozone debt crisis mean for investors? Well, for one thing, the markets will remain volatile for some time yet. There will be more gnashing of teeth as European welfare state economies contend the realities of long term unsustainable deficit spending and oppressive tax regimes. The options for countries with 150% debt/GDP become fewer and worse. The central planners will resort to ever more debasement of the currency at the expense of individual purchasing power and increased demand. Weaker demand in Europe for American exports will dampen the sluggish (and jobless) US recovery. Funds will flow out of the Euro and out of stocks and into “safer” assets and currencies such as the Dollar, the Swissy and gold.

We can see that the concerns over the Euro crisis and also concerns over an uptick in the latest US unemployment rate have caused the ‘Fear Index” for stocks to jump. The “Fear Index” is the CBOE Market Volatility index, which trades by the symbol VIX. The VIX is quoted in percentage points and translates to the expected movement in the S&P 500 index over the upcoming 30-day period, which is then annualized.  The VIX has an inverse relationship to stock prices. That is, when the VIX trades up, stocks tend to decline. The higher the VIX climbs, the lower go stocks. The VIX is indicating we are in for some more volatile times in stocks.

We can also see that gold has outperformed the S&P 500, and is less volatile than the broad stock index. Recent volatility has erased earlier gains of the S&P 500. The VIX is portending rougher weather ahead for stocks. At the same time, gold has regained some luster. Gold will climb higher if the ECB decides to resume its bond-buying program.


So where will the smart money go as the European debt crisis plays out?  The smart money will buy gold. Gold is a store of value. Gold benefits from government intervention in the credit markets.  Gold increases in value as new fiat money is printed.  Gold appreciates in times of economic uncertainty.  At today’s prices, gold is a bargain.

Responsible citizens and prudent investors protect themselves and their wealth against the ambitions of over-reaching government authority and debasement of the currency by owning gold. Gold is honest money. Investors from around the world benefit from timely market analysis on gold and silver and portfolio recommendations contained in The Gold Speculator investment newsletter, which is based on the principles of free markets, private property, sound money and Austrian School economics.

The question for you to consider is how are you going to protect yourself from the vagaries of the fiat money and economic uncertainty?  We publish The Gold Speculator to help people make better decisions about their money. Our Model Conservative Portfolio has outperformed the DJIA and the S&P 500 by more than 3:1 over the last several years. Follow @TheGoldSpec   Subscribe at our web site www.thegoldspeculatorllc.com  with credit card or PayPal ($300/yr) or by sending your check for $290 ($10 cash discount) The Gold Speculator, 614 Nashua St. #142 Milford, NH 03055

Tuesday, May 22, 2012

Another Hike for Gold


By Scott Silva
5-22-12

Things may be looking up for gold bugs. The sellers are gone, and the bargain hunters have returned. Is this the reversal gold bugs have been waiting for? Or is it a short term bounce only to be followed by another leg down? Technical analysis says we may be seeing the beginning of another powerful upswing for the precious metals and gold and silver stocks.

Gold and silver stocks have been under pressure over the last several weeks. But we now are seeing signs of a bullish reversal. A look at the technical indicators for the HUI gold stock index gives us the first hint. The indicators we will examine here are Ichimoku Kinko Hyo, candlestick analysis and Moving Average Convergence/Divergence (MACD). Taken together, these technical indicators provide a degree of corroborated information from which to trade.


So let’s look what these three technical indicators are telling us about the HUI. We can see from the daily basis chart that on May 16th, the HUI halted its slide begun earlier this month, and has traded up in the last several sessions. Price action on May 16th produced a doji candlestick. The doji typically marks a reversal in an established trend. The doji candlestick has a long shadow and a small body, which traces out the push and pull between buyers and sellers, and reflects the fact that neither buyers nor sellers dominated the day’s trading. We can see that the May 16th doji in fact marked a bullish reversal at the 376.86 level. The long white candle on May 17th and following sessions pushed the HUI up to 412 or so.

The next set of indicators to examine is Ichimoku trend and momentum. Today, most Ichimoku indicators are bearish, but there are some bullish signs. Price action is below the cloud, which is bearish. The projected cloud is bearish (shaded pink) with Span A below Span B. And the Chikou Span (green trace) is below price action and the below the cloud, which is a bearish signal. Yesterday, price action climbed briefly above the Kijun Sen (red trace), which is a bullish sign. The Chikou Span, the momentum indictor, has made a move up, and could climb up to the breakout area covering the 420-470 price levels. In this area, the Chikou Span would be above price action, which would be a strong bullish indicator. From there, price action could break above the cloud at 444, the projected resistance level. By then, the projected cloud would be bullish as well.

The near term dynamic displayed by the MACD shows that the breakout scenario may in play already. The MACD shows the HUI to be oversold, with an index bottoming out at -20.0 on May 16th, then making a bullish crossover on May 21st.

Aggressive traders use MACD crossover signals to buy and sell. More conservative traders are happy to wait for the trend to develop fully, as indicated by all five Ichimoku indicators before committing capital. There are trading rules and strategies that combine Ichimoku with other technical indicators that work well in volatile markets. Aggressive and conservative investors alike can benefit from technical analysis of gold and gold silver stocks. Our analysis of the HUI is telling us we may be seeing blue skies for gold and silver stocks soon.

Responsible citizens and prudent investors protect themselves and their wealth against the ambitions of over-reaching government authority and debasement of the currency by owning gold. Gold is honest money. Investors from around the world benefit from timely market analysis on gold and silver and portfolio recommendations contained in The Gold Speculator investment newsletter, which is based on the principles of free markets, private property, sound money and Austrian School economics.

The question for you to consider is how are you going to protect yourself from the vagaries of the fiat money and economic uncertainty?  We publish The Gold Speculator to help people make better decisions about their money. Our Model Conservative Portfolio has outperformed the DJIA and the S&P 500 by more than 3:1 over the last several years. Follow @TheGoldSpec   Subscribe at our web site www.thegoldspeculatorllc.com  with credit card or PayPal ($300/yr) or by sending your check for $290 ($10 cash discount) The Gold Speculator, 614 Nashua St. #142 Milford, NH 03055

Thursday, May 17, 2012

A Rainbow for Gold?

By Scott Silva
5-15-12


Woe is me! The market is falling! When will it all end? Many who own gold and silver are losing sleep over the current downturn in precious metal prices. Some are ready to sell their long term holdings, for fear the market has yet to bottom and prices will continue to fall. The abyss seems bottomless. All hope is lost.

Well, things may not be so dire. The end of the world may not be so close at hand. There are forces building that will serve to propel gold and silver prices to new highs. Gold and silver are at attractive prices for bargain hunters who may be more cool-headed than the throngs of amateurs that rush to sell at the intermediate low.

It is human nature to want to conserve what a person has earned. For most retail investors, the immediate reaction during market downturns is to sell. Fear overtakes reason, and selling begets more selling. Prices tend to change much more quickly when the electronic trading algorithms take over, followed quickly by the cowardly crowds. These are the same retail investors, by the way, who tend to pile in at market tops, afraid to miss out on the big score. But most retail investors get it exactly wrong. They sell low and buy high, the certain way to go broke.

Why do so many people give their money away to the markets? It has as much to do with training, specifically the lack of training and discipline, than psychology.  Fear and greed may be the great motivating emotions that drive the market, but control of fear (and greed) through training and discipline allows the investor and speculator to profit in the markets while others fail. This is true for any market. The trick is to learn to act apart from the crowd, move contrary to the path of the mob. The mob is motivated by fear and greed. The contrarian investor takes advantage of the untrained mob by selling to them when they jump in at the market top, and buying from them when they are compelled to sell at the market bottom.

The rise in gold to $1900/oz last year, and the fall in gold to $1550/oz this year are good examples of this dynamic. We can see from the gold futures chart how gold climbed in price, and more recently, how gold has come down in price. What’s important is the trading volume associated with these moves. Volume tells us the relative ratio of buyers and sellers who are acting in the market. When prices rise, there are more buyers than sellers.  Trading volume (left scale) climbed to over 400, 000 contacts when the buyers came in to run the gold price last August. Trading volume also spiked above 400,000 contacts during the sell-off of late September of last year. When prices decline, it is because there are more sellers than buyers acting. We can see a similar relationship, but at the 350,000 contract volume level in the moves up and down so far this year.  To make money from these moves, the trader must act against the market. That is, the successful trader sells into rallies, and buys the dips. Most professional traders then can be characterized as contrarian. They act precisely opposite of the herd.  


We are seeing a market bottom in gold and gold stocks now. Many institutional advisors are telling their retail clients to sell gold and gold stocks just now. But we are not seeing a spike in selling volume. We may be running out of selling pressure. When there are no more sellers, the momentum will shift to the buyers. But some of us will have already bought, and will be ready to sell into the next rally. If there are more storm clouds on the horizon for gold, then let it rain. After all, there cannot be a rainbow without the rain.  So let the sellers sell and sell. I’ll buy and buy.

Responsible citizens and prudent investors protect themselves and their wealth against the ambitions of over-reaching government authority and debasement of the currency by owning gold. Gold is honest money. Investors from around the world benefit from timely market analysis on gold and silver and portfolio recommendations contained in The Gold Speculator investment newsletter, which is based on the principles of free markets, private property, sound money and Austrian School economics.

The question for you to consider is how are you going to protect yourself from the vagaries of the fiat money and economic uncertainty?  We publish The Gold Speculator to help people make better decisions about their money. Our Model Conservative Portfolio has outperformed the DJIA and the S&P 500 by more than 3:1 over the last several years. Follow @TheGoldSpec   Subscribe at our web site www.thegoldspeculatorllc.com  with credit card or PayPal ($300/yr) or by sending your check for $290 ($10 cash discount) The Gold Speculator, 614 Nashua St. #142 Milford, NH 03055

Sunday, May 13, 2012

May Day in Paris

By Scott Silva
5-8-12

It’s May Day again in Paris. Over the weekend, French voters elected Socialist Party leader François Hollande who promises to repeal all austerity measures in favor of a robust Keynesian spending program. This development is a setback for EU fiscal stability, and will likely undermine Franco-German cooperation and may spell the end of the Eurozone. What effect will the new socialist regime in France have on us here in the United States? Is socialism the answer to our economic problems? What affect will socialist Europe have on my portfolio?

May 1st is celebrated traditionally in most socialist, Marxist and communist countries as Labor Day and International Workers' Solidarity Day. It is commonly marked by organized street demonstrations, parades and marches by working people and their labor unions throughout most of the world. In the heyday of the Soviet Union, May Day in Red Square included a parade of the latest military equipment, a feast for cold war intelligence analysts and NATO war planners.  Nowadays, May 1st is a national holiday in more than 80 countries. It is also celebrated unofficially in many other countries.

The United States has attempted to counter the left-wing May Day tradition. In 1921, following the Russian Revolution of 1917, the Veterans of Foreign Wars and other conservative groups promoted May 1st as Americanization Day. In 1949, the holiday was renamed Loyalty Day. In 1958, Congress declared May 1st Loyalty Day a national holiday. Popular recognition of labor-centered May Day has largely died out in the US. No longer do labor union-led crowds gather as thousands did in Times Square every May 1st during the Great Depression.  Last week, fewer than 100 Occupy Wall Street protesters showed up at Bryant Park in midtown Manhattan as part of the planned nationwide Occupy General Strike.

It’s no wonder that May Day and its modern day Occupy movement has failed to take hold in the United States. Collectivism has failed everywhere it has been tried. Communism failed in the Soviet Union. It failed in Cuba. It failed in South and Central America. It failed in communist China and North Korea. And the welfare state is failing today in Greece, Spain, and France.

Collectivism may show early signs of success. But economic prosperity in the collective state is fleeting and deceptive.  Sooner or later the fundamental flaws of central planning reveal themselves. Price control, production control and “fairness” give way to corruption, graft and shortages. The central planners create the illusion of success built on a body of lies. The hint of prosperity for all provided by a benevolent government hand gives intervention its pernicious, seductive appeal. In the long run, collectivism in all its forms has always proven to be the path to tyranny and misery.

As Margaret Thatcher observed “"The problem with socialism is that eventually you run out of other people's money [to spend]." Apparently, citizens of France and Greece have yet to learn this lesson. In elections over the weekend, voter backlash to strict austerity regimes in the debt-ridden Eurozone countries toppled conservative French president Nicolas Sarkozy in favor of anti-austerity Socialist Party candidate François Hollande, and fascist anti-austerity factions defeated the centrist coalition Greek government which had negotiated the EU/IMF bailout based on massive budget cuts. The radical reversal presents a new existential threat to Eurozone and to the Euro as a currency.

Socialism does not work because it is inconsistent with fundamental principles of human behavior. The failure of socialism in countries around the world can be traced to one critical defect: it is a system that ignores incentives. The welfare state seeks to replace incentives with “entitlements”. The government that delivers “free” goods and services expects to gain voter loyalty and remain in power. We can see the flood tide of welfare state entitlements swirling in to swamp federal budgets and submerge the nation into unprecedented debt. Any thinking person knows that 100% debt/GDP is unsustainable. The demise of Eurozone economies under the weight of crushing national debt and an aging, dependent population should provides a clear, real-time example.

But Washington central planners are blind to the failure of the European welfare state. The current Washington regime clings to the notion that the Federal government has the solution to every problem. Government intervention is the answer to any ailment. The snake oil comes in many flavors: “Free” healthcare for all;  Social Security retirement benefits for all and forever; affordable mortgages through federally mandated load modifications; low cost, subsidized college loans for all, with no repayment after 10 years!” And on and on.  It doesn’t matter that budget cannot support current federal spending. And it matters not that we must borrow 40 cents of every Dollar the federal government spends. Will foreigners buy US debt when the US debt reaches 120% of GDP?  Or 150%? Will anyone buy US debt when entitlements consume 100% of federal revenue?

Well, to be fair, socialism would work if central planners could anticipate demand and control production and distribution perfectly. We need only look at the Chevy Volt to conclude that government has great difficulty in judging demand for even one product, never mind the millions of products and services that make up the US economy. The genius of capitalism is that it accounts for demand, price, production and distribution of every product and service through the “hidden hand” of the free market and the incentives that accrue on through private property.
Free markets operate most efficiently when government intervention is minimal, or as Thoreau wrote in 1849 in his Civil Disobedience, “That government is governs best which governs least”.

In a capitalist economy, incentives are of the utmost importance. Market prices, the profit-and-loss system of accounting, and private property rights provide an efficient, interrelated system of incentives to guide and direct economic behavior. Capitalism is based on the theory that incentives matter. Capitalism works because it is aligned with the principles of human behavior. Adam Smith recognized the driving force of economics to be self interest. Individuals act in their own self interest, and respond to incentives of the marketplace. Capitalism is the best hope for the individual liberty and prosperity.

How can we tell that the current path towards the all-encompassing welfare state is failing? We can ask ourselves a simple question:  “Are we better off today than we were four years ago?”

There answers are clear and stark. Real wages are lower than they were four years ago. Prices are higher than they were four years ago.  Gasoline prices have more than doubled. Bread, eggs and coffee prices are higher. Mortgage rates are down, but 22.8% of all US mortgages are underwater. Unemployment remains at Great Depression levels- 14.2% including those unemployed, underemployed or no longer looking for work. Taxes are high and will be higher yet if the Bush tax cuts expire at the end of the year and new taxes kick in to support national socialized medicine. Education costs continue to rise by 7% or more each year.

May Day in Paris (and Greece) marks a return to socialist and fascist economic policy. Similarly, current White House economic policy is based on principles put forth by John Maynard Keynes and Karl Marx, namely, the font of prosperity is government redistribution of wealth and government intervention is virtuous.

So what can investors expect from the socialist revival in France and return to fascism in Greece? We are seeing the dynamic play out in the markets today. Stocks are selling off for the second day in a row. The Euro is trading down below the $1.30 mark, and funds are flowing into US Treasurys. The stronger Dollar is pushing commodity prices down; oil is trading below $100/bbl and gold is testing the $1600/oz support level.

Gold bugs see strong support at the $1600/0z level, the price that typically brings in the bargain hunters. The reason for this is longer term prospects for gold are bullish. New government spending sprees in the Eurozone will further debase fiat currencies which is bullish for sound money. The US economy continues to struggle; White House economic policy and US monetary policy have failed to stimulate robust economic recovery. Additional poor economic data will tempt the Federal Reserve to enter into a third phase of Keynesian Quantitative Easing later this year, which will weaken the Dollar and push gold prices up.

Responsible citizens and prudent investors protect themselves and their wealth against the ambitions of over-reaching government authority and debasement of the currency by owning gold. Gold is honest money. Investors from around the world benefit from timely market analysis on gold and silver and portfolio recommendations contained in The Gold Speculator investment newsletter, which is based on the principles of free markets, private property, sound money and Austrian School economics.

The question for you to consider is how are you going to protect yourself from the vagaries of the fiat money and economic uncertainty?  We publish The Gold Speculator to help people make better decisions about their money. Our Model Conservative Portfolio has outperformed the DJIA and the S&P 500 by more than 3:1 over the last several years. Follow @TheGoldSpec   Subscribe at our web site www.thegoldspeculatorllc.com  with credit card or PayPal ($300/yr) or by sending your check for $290 ($10 cash discount) The Gold Speculator, 614 Nashua St. #142 Milford, NH 03055


Wednesday, April 11, 2012

Gold Stocks Ready to Rise?

By Scott Silva
4-10-12

Some are calling the bottom for gold mining stocks. One popular measure for the gold miners is the NYSE Arca Gold BUGS Index, trading on AMEX under the symbol HUI. The HUI Index was developed with a base value of 200.00 as of March 15, 1996. The AMEX Gold BUGS Index currently consists of 15 of the largest and most widely held public gold production companies. Other gold miner indices include the Philadelphia Gold and Silver Index (symbol XAU) comprised of sixteen precious metal mining companies. The HUI and the XAU each contain several of the same mining companies, so the indices tend to move together. The HUI and the XAU are the two most watched gold indices on the market.  Let’s look at the HUI from a technical standpoint to see if the gold mining stocks have bottomed.


Some analysts rely on crosses of the 50-day and 200-day moving averages as indicators of a trend reversals. We can see the bearish cross back in early December on the daily basis chart and the subsequent bearish price action in the HUI then and later in March. The daily chart gives no sign of change to the bearish trend. According to this indicator, the HUI looks to be headed lower yet.

The monthly basis chart is not so bearish. In fact, according to the 50-day and 200-day cross, the HUI has been in bull trend since November 2009. The March 2012 decline seems to have halted 440, precisely at the 200-day moving average support level. A break below 440 on the weekly chart would be significant, indicating a further decline to the 375 support level. So, the daily chart and the weekly chart yield conflicting views of likely future price action for HUI.


This is not uncommon for the 50-day and 200-day moving average indicators, which is why many
traders use Ichimoku Kinko Hyo technical indicators to guide their trading decisions. As you have read in these pages before, Ichimoku analysis gives the trader a more accurate view of trends and momentum of any traded security than other technical trading tools. We use Ichimoku indicators combined with other technical tools to make trading recommendations for the Model Conservative Portfolio in The Gold Speculator investment newsletter. So what does Ichimoku tell us about the HUI?


We can see from the “one look, equilibrium chart” above, all Ichimoku indicators for HUI on the daily basis are bearish. The index has been driven down to support levels four times this year, with the most recent decline in March and April.


The Ichimoku indicators for the HUI are bearish on the daily basis chart above and bearish also on the weekly chart. Price action is below the cloud, which is bearish. The projected cloud is bearish. The Tenkan Sen made a bearish crossover of the Kijun Sen March 3rd. And the Chikou Span is below price action and below the cloud which is bearish. The separate MACD oscillator made a bearish crossover on April 4th.

For the conservative investor, selecting specific gold stocks has been more effective than buying the index this year. Shorting the index, on the other hand, has proved effective for the more aggressive speculator. Bottom feeder speculators may see an opportunity at current price levels, but the technical trend is bearish, and there is no technical sign of a reversal in the established bearish trend for this broad gold stock index.

Responsible citizens and prudent investors protect themselves and their wealth against the ambitions of over-reaching government authority and debasement of the currency by owning gold. Gold is honest money. Investors from around the world benefit from timely market analysis on gold and silver and portfolio recommendations contained in The Gold Speculator investment newsletter, which is based on the principles of free markets, private property, sound money and Austrian School economics.

The question for you to consider is how are you going to protect yourself from the vagaries of the fiat money and economic uncertainty?  We publish The Gold Speculator to help people make better decisions about their money. Our Model Conservative Portfolio has outperformed the DJIA and the S&P 500 by more than 3:1 over the last several years. Follow @TheGoldSpec   Subscribe at our web site www.thegoldspeculatorllc.com  with credit card or PayPal ($300/yr) or by sending your check for $290 ($10 cash discount) The Gold Speculator, 614 Nashua St. #142 Milford, NH 03055


Tuesday, April 3, 2012

None so Blind

By Scott Silva
4-3-12

It seems the administration can never see the realities that stifle economic growth-- the hard realities right before their eyes that most of us see and must deal with every day. The terrible trio at the controls of the US economic engine is driving us not into a ditch, but over a cliff. The Fed Chairman is flooding the economy with too much liquidity. The Treasury Secretary believes the best way to recovery is through more government spending, taxing the rich and forcing broader redistribution of the nation’s wealth. The president’s vision for prosperity is government control of production and economic equality. Our elected leaders pander and deceive in full-time re-election campaign mode, with Newspeak and misdirection to mask the realities of high unemployment, high consumer prices, falling wages and slow economic growth.

The scorecard for the last three years is clear and bleak. The US credit rating has been downgraded. The Dollar is weak. Unemployment is at Depression-era levels. 46 million Americans are on food stamps, an all-time high. 2.6 million people slipped into poverty last year, bringing the total in America to 46.2 million, a 52-year high. Housing prices continue to fall and the number of foreclosures continues to rise. Commodity prices are high. $4.00/gal gasoline prices are forcing consumers to cut back. Corporations are not hiring, opting instead to hoard $1.7 Trillion in cash that would otherwise go to capital investment, expansion and new hires.

The simple fact is economic policies put forth by Washington today have never created wealth or prosperity anywhere or any time in history. No one has ever become wealthy by taxing the rich. Socialist redistribution has always failed. And the majority of hard-working citizens know just how out-of-touch the Washington ruling class is.

In the 1700’s, the Age of Enlightenment, the field of economics was known as the “Political Economy”. Political Economy originally referred to the study of production and commerce and their relation to law, custom, and government. It also referred to the distribution of national income and wealth through the political budget process. Political economy is rooted in moral philosophy, the ethics of right and wrong behavior. Since the 1900’s, the study of such relationships adopted some elements of scientific method, and became known as the science of economics. But economics is not a science bound by the laws of physics, which is why most political economic theories such as communism, socialism and fascism largely fail, save one, namely laissez-faire capitalism.

The economic policies of overarching Federal government control, Fed intervention, crony-capitalism, growing entitlement class, and massive wealth redistribution are morally bankrupt and injurious to individual liberty and happiness. All free citizens should resist tyranny and plunder forced on them by out-of-control Federal government. And here is how.

Own True Money.  Gold has been the only true money for over 3,000 years. Buy and own gold as a store of value to protect your wealth against the vagaries of fiat currency.
We have seen the unprecedented debasement of the Dollar by ultra-easy Fed policy and the printing of $3Trillion out of thin air. The growth of the money supply has outstripped growth in output which has caused prices to climb and the purchasing power the Dollar to fall.
           
Deleverage.  Eliminate consumer debt. Invest in hard assets.

            Be Vigilant.  Stay informed on current legislation that may impact your financial wellbeing. Take action to protect your individual liberty and private property against incursions from federal, state and local governments.

            Be Prepared. Make preparations to protect yourself, your family and your property for an environment Without the Rule of Law. Read Atlas Shrugged by Ayn Rand.

            Vote. Vote for pro-growth candidates who respect and will defend the Constitution.

The difference between ultra-progressive economic policies and pro-growth economic policies are clear in our history. Plymouth colony nearly perished under its first government, which was based on the communist principles of central planning, labor classes and government owned property. The fledgling colony only survived by later recognizing that its members tended to work harder to generate healthy crops and individual wealth by cultivating their own private land, rather than working the “common land for the common good.”  In the 1930’s the “common good” became the rationale for massive government intervention in the labor markets, in which the federal government taxes the labor of young workers to support retirement “entitlements” for the elderly. But demographics have changed such that Social Security will be bankrupt in ten years without massive reform. Perhaps the best comparison between progressive vs. pro-growth policies is a look at the Reagan years and today’s administration.

As did Reagan, Obama came into office during recession. In the current recovery, real GDP has averaged 3%.  Employment as defined by nonfarm payrolls and reported by the BLS has edged down from 10.2% in early 2010 to 8.3% in March.  Actual unemployment today (BLS U-6 measure) is 14.9%, up from 14.1% when Obama took office. During Reagan's recovery real GDP averaged 7.7 percent annually while nonfarm payrolls rose by 5.3 million.  Reagan reduced inflation from 12.2% when he took his first oath of office as president to 4.4% in his last year of office. Today, inflation is negligible at 2.1%, according to the Fed, yet everyday citizens pay much more to live this year than last year, and the years before that.

Why are there such major differences in US economic performance under Obama and Reagan?  Reagan saw free market, private-sector enterprise as the road to prosperity.  Obama has chosen massive expansion of the federal government as the way forward.

Obama's first act was an $835 billion government-spending package.  One of Reagan's first decisions was to cut $50 billion (($100 billion in today’s dollars) from domestic spending.  Obama focused priorities on nationalized health-care, energy cap-and-tax-and-trade, and pro-union card check. Reagan focused on free market measures; he ended wage and price controls, deregulated all energy prices and fired the striking federal union air-traffic controllers.

Reaganomics spurred growth through limited government, a strong dollar and lower taxes. Reagan slashed marginal tax rates from 70 percent to 28 percent. Reagan’s lower tax rate policy (attributed to the Arthur Laffer) actually raised tax revenues from $300 billion to $450 billion.

The current administration seeks to raise tax revenue, particularly for the nation’s highest earners. In his fiscal 2013 budget, released earlier this month, the president would allow the Bush tax cuts to expire for income above $200,000 for individuals and $250,000 for couples and charge a new 3.8 % tax on net investment income above those levels.

Under Reagan, overall federal spending dropped from 23 percent of GDP to 21 percent. Obama has grown the size of government to 25 percent of GDP.

Reagan ran a budget deficit of about 3 percent of GDP, the same percentage left by Carter. Obama’s 2011 budget deficit was $1.6 Trillion or 11% of GDP.

Reagan believed in sound money and a reliable currency. It was Reagan’s pro-growth tax cuts and counter-inflationary monetary policy that ultimately reversed the 15-year decline in the US Dollar.  Since 2009, the Fed and central banks have flooded the world with more and more paper money. More dollars, Euros, Yuan and Yen have steadily pushed up commodity prices at the expense of currency values. The US Dollar, for instance, has fallen 17% since February 2009, when the $838 Billon American Recovery and Reinvestment Act of 2009 was passed.

 GDP priced in gold gives us further insight. We can see the upswing in gold-priced GDP in the post WWII boom, the decline in the Carter years, the resurgence under Reagan, Bush ‘41, Clinton and Bush ‘43, and the fall under Obama.


Overall, Reagan's free-market, pro-growth policies created 21 million new jobs as real GDP averaged 3.5 percent annually for seven of his eight years in office. The unemployment rate dropped by over 50%.  The stock market doubled, and household net worth expanded by $8 trillion.

The Obama administration believes that increasing the size and scope of government is the path to prosperity.  In 2009, rather than allow large banks, insurance companies, mortgage companies and Detroit automakers to fail due to market pressures, Obama nationalized them using taxpayer dollars to bail them out.  That same year, the administration projected its new stimulus package would “create 3 to 4 million jobs.” But most of the funds went to state governments that used the windfall funds to close their own budget gaps. Few permanent jobs were created. The private sector jobless rate actually increased.

So which is the path to prosperity?  Gold and silver prices give the answer. Gold had quintupled during Jimmy Carter’s recession; gold and silver hit new all-time highs under Obama.  Gold prices fell 40% (from $750/oz to $450/oz) under Reagan’s 8-year presidency.

The price of gold has nothing to do with political ideology or government reports on the status of the economy. The gold market sifts through the myriad of economic data, investor sentiment and global events to measure reality with crystal clarity. Gold is trading at all-time highs, in direct contradiction to reports of sustained growth in the world’s largest economy. It just might be that massive deficit spending and easy money policies have little or no stimulative effect on the economy and that government spending does not create jobs in the private sector. Because the government must tax or borrow in order to spend, it takes money from citizens and businesses that otherwise would go to consumption, savings or investment to produce more wealth.

Likewise, the gold market shows government reports of low inflation and growing employment to be false. We have seen on these pages before that actual US inflation is closer to 10% than the reported 2.1%, and the actual US unemployment rate today is 14%, a rate not seen since the 1930’s. 

Re-election campaign politics from the bully pulpit further distort economic realities. The administration cites an increase in US oil production, while it thwarts added production (and new job creation) by rejecting new drilling permits and the XL Pipeline project. The administration cites 2.3 million new jobs were created through its renewable energy initiatives, at the same time that government-backed alternative energy companies Solyndra and Fisker Automotive go bankrupt, and GM suspends Chevy Volt production for lack of demand for the expensive, short range electric car, having wasted billions of taxpayers’ dollars. Last week the Supreme Court took up the constitutionality of the individual mandate and other provisions of the Patient Protection and Affordable Care Act (Obamacare) while earlier last month the CBO reported that the cost of implementing the federally mandated universal healthcare program has nearly doubled to $1.76 Trillion over the next ten years. More distortions in the name of re-election are surely coming our way. As Diogenes, one must lift his lamp and be ever on the search for an honest man. There are none in power in Washington today.

Responsible citizens and prudent investors protect themselves and their wealth against the ambitions of over-reaching government authority and debasement of the currency by owning gold. Gold is honest money. Investors from around the world benefit from timely market analysis on gold and silver and portfolio recommendations contained in The Gold Speculator investment newsletter, which is based on the principles of free markets, private property, sound money and Austrian School economics.

The question for you to consider is how are you going to protect yourself from the vagaries of the fiat money and economic uncertainty?  We publish The Gold Speculator to help people make better decisions about their money. Our Model Conservative Portfolio has outperformed the DJIA and the S&P 500 by more than 3:1 over the last several years. Follow @TheGoldSpec   Subscribe at our web site www.thegoldspeculatorllc.com  with credit card or PayPal ($300/yr) or by sending your check for $290 ($10 cash discount) The Gold Speculator, 614 Nashua St. #142 Milford, NH 03055


Tuesday, March 20, 2012

Fed Liquidity: Good as Gold

By Scott Silva
3-20-12

We all have experienced that sinking feeling when in difficult times; we seem to have run out of options. Sometimes our frustration gets the better of us as we lash out at anyone or anything however innocent. But kicking the dog is no solution to our problems.

Chairman Bernanke is acting beyond reason lately. He has realized what others have known for some time--his monetary stimulus has failed to jump start the economy. The Fed is now grabbing at straws, hoping that “increased visibility” into Fed forecasts, and “closer communication” with the public will somehow reverse the ebbing economic tide. The Fed chief seems at ends, ready to point the blaming finger at unsustainable fiscal spending and Congressional gridlock, and phantom “headwinds” as the culprits for the stalled economy.

But increased visibility into Fed forecast models is not helping. New economic data is inconsistent and contradictory. Much of it is biased by re-election campaign politics which mask actual data with much more optimistic numbers. Actual US unemployment for February, for instance, was 14.1% (U-6), not the 8.3% that the administration touts. Likewise, the Fed understates inflation, and forecasts optimistic inflation “central tendencies”.

The fact is, Fed monetary policy has been ineffective. Monetary policy cannot fix unchecked deficit spending, massive Federal debt and oppressive federal taxes and regulation. Rather than allow market forces to correct, the Fed is overwhelmed by the urge to take action. The Fed action is limited to maintaining its zero interest rate policy and buying more bonds. So Wall Street hangs on every word. When Bernanke does not mention QE3, as he did in his last public meeting, the markets plummet. When the Wall Street Journal reports the Fed is considering a new “sterilized” bond buying spree, the Dow jumps 200 points. This is no way to build the foundation for sustained economic recovery.

What we can rely on is more of the same from the Fed. As new uneven economic data emerges, the Fed will fall back to a third dollop of Quantitative Easing. Most bank economists have already trimmed GDP estimates for 1Q2012 down to 1.7% from 3.0% last quarter. Higher oil and gasoline prices are already slowing economic activity. Last week, consumer confidence fell below expectations. Friday, Chicago Fed president Charles Evans called for the Fed to take additional action now to “accelerate the pace of recovery”.

The EU is fully aboard the QE bandwagon. It will add another €1Trillion to combat the debt crisis. China is also easing. Election-year politics are likely to muddle things further. The president needs to show some improvement in the economy to be re-elected. So far his record has been dismal on that count. So his economic team will be pushing the Fed to buy more bonds. What this means for investors is more volatility and more QE is on the way.

QE, the Dollar and Gold

We have seen the effect QE has had on the value of the Dollar and the price of gold. QE weakens the Dollar and boosts gold prices. This is because adding to the money supply debases the currency which reduces its purchasing power. When the Dollar is weak, it takes more Dollars to buy an ounce of gold, so the price of gold in Dollars rises. That is why people over the centuries have stored their wealth in gold.

One of the primary stimulus measures implemented by the Federal Reserve over the last three years has been the injection of cash into the economy by giving money to the banks. The scale of the cash injection is unprecedented– officially, the Fed has pumped over $2.3 Trillion into the banks. The Fed also pumped more than $16 Trillion into banks in secret loans recently uncovered by Congressional audit. In 2009, the US economy was in a deep recession, with the potential, it was thought, to slip into the Second Great Depression. The Fed and many demand-side economists believed that adding liquidity during a period of deflationary recession would have a stimulative effect on the economy. With more credit from the Fed, banks would lend more, making more money available to consumers to spend and businesses to expand to meet the increased demand. Recession would then give way to broad economic expansion and prosperity, with low unemployment, rising wages and strong GDP growth.

The idea that increasing the money stock increases aggregate demand has been around for decades. In 1936, John Maynard Keynes first presented the idea in The General Theory of Employment, Interest and Money.  Keynes believed that government is more effective than the private sector at stabilizing the business cycle.  In his model, control is applied by central bank monetary policy and government fiscal policy. Keynesian theory served as the economic model during the later part of the Great Depression, World War II, and the post-war economic expansion. Japan implemented Keynesian policies in the 1990’s; the “Lost Decade” resulted. Since the financial crisis of 2007, the US, the UK and much of the EU have relied on Keynesian stimulus programs as the basis of their recovery efforts.

Quantitative Easing (QE) has weakened the currency in every case. We can see the effect QE on the Dollar.

We have seen the effects of Fed monetary policy on the US Dollar. The Dollar buys 17% less today than it did in 2009 when the Fed increased its balance sheet with bonds paid for by printing money.  The new “sterilized” bond-buying of QE3 will further debase the Dollar, shrinking its purchasing power for all who use the currency.


Many see similarities to the 1970’s in the today’s economic conditions. The US economy was failing during the Carter years. The 1970’s were characterized by “stagflation”, that debilitating mix of high inflation and slow growth. Double digit inflation, single digit growth and lack of leadership forced Carter out after a single term as president. 

Today oil prices are high, prices for food and other necessities are high, unemployment is high and the economy is limping along, barely growing. The misery index, coined in the 1970’s, has returned as a measure of popular dissatisfaction with the nation’s economic policies.

Chairman Bernanke’s Fed policies are similar to Fed policies in the 1970’s. In both periods, the Fed responded to recession by expanding the money supply, although the scale of monetary expansion in the recent case is unprecedented. Under Fed Chairman Burns, monthly money growth, which had averaged 3.2 percent in the first quarter of 1971, jumped to 11 percent in the same period of 1972. The money supply grew 25 percent faster in 1972 compared to 1971. Money supply growth under Chairman Bernanke has been nothing short of remarkable.

Debasement of the Dollar has made many eager to shift out of Dollar denominated assets into hard, commoditized assets precisely because dollars are losing value. We have seen this trend in history. Gold prices tripled in 1980-1981; gold has double in price since 2009. Prior Fed QE policy has boosted the price of gold, and QE3 at $1Trillion will likely push gold above $2000/oz.

Investors from around the world benefit from timely market analysis on gold and silver and portfolio recommendations contained in The Gold Speculator investment newsletter, which is based on the principles of free markets, private property, sound money and Austrian School economics.

The question for you to consider is how are you going to protect yourself from the vagaries of the fiat money and economic uncertainty?  We publish The Gold Speculator to help people make better decisions about their money. Our Model Conservative Portfolio has outperformed the DJIA and the S&P 500 by more than 3:1 over the last several years.   Subscribe at our web site www.thegoldspeculatorllc.com  with credit card or PayPal ($300/yr) or by sending your check for $290 ($10 cash discount) The Gold Speculator, 614 Nashua St. #142 Milford, NH 03055

Wednesday, March 7, 2012

Stealthy QE3

By Scott Silva
Editor,  The Gold Speculator   
www.thegoldspeculatorllc.com
3-7-12

Today, there are new reports that the Federal Reserve is planning to inject more cash into the ailing economy though another round of Quantitative Easing (QE3). You have read in these pages before that More QE is on the Way (1-23-12, The Gold Speculator).  The new bond-buying program would be “sterilized” by coincident selling of short-term instruments in an effort to control increased inflation that would result from the addition of another $1 Trillion or so to the money supply. This approach is not new; the ECB has used large, “sterilized” bond purchases over the last year in its attempt to stimulate the Eurozone economy and provide bailout funds to ailing European banks.

The Fed bond-buying program would be the third attempt to jumpstart the US economy through aggressive monetary policy. The previous cash injections added $2.3 Trillion to the Fed’s balance sheet. The results of Fed stimulus efforts have been underwhelming. US unemployment has actually increased since QE1 was implemented in 2009 and the larger QE2 in 2010.  Today, the US Labor Department, Bureau of Labor Statistics reports US unemployment at 15.1% (U-6), up from 14.1% in January 2009. And GDP continues to limp along at 1% to 3% since QE2 went into effect.


Milton Friedman instructs us that “Inflation is always and everywhere a monetary phenomenon in the sense that it is and can be produced only by a more rapid increase in the quantity of money than in output.” (The Counter-Revolution in Monetary Theory, 1970). The Fed policy of extended accommodation has increased the money supply (M2 measure) to $9.8 Trillion. M2 includes demand deposits (M1) plus small time deposits, money market funds and the like. M2 is considered money available to the transactional economy. These levels are unprecedented, and we can see supply has increased almost $1 Trillion in the last twelve months.


The Fed reports inflation is modest at 2.0%. But as anyone who buys food or fuel knows, prices for everyday goods have increased by multiples since the Fed first implemented Quantitative Easing.  The problem is the growth of the money supply greatly outstrips the growth in output, the sum of all production of goods and services. When more money chases the same amount of goods, prices rise.


We can see the rise in prices in the rise in the CRB commodity index. Higher commodity prices, particularly oil-based energy products, dampen economic activity, and slow economic growth. This is another example of Bastiat’s “unseen” effects. The Fed’s policy, in fact all government intervention, is counterproductive to true economic growth. So as more and more poor economic data emerges, it is no wonder that the Fed is now preparing to revert once again to the only tool in its “stimulus” tool bag:  additional Quantitative Easing (QE3).

With every new Dollar the Fed prints, the value of each Dollar in your wallet declines. And the price of any commodity priced in Dollars increases. We can see that dynamic play out in the CRB index, and in particular, the price of oil. Certainly there is a “war” premium priced into oil, as Iran threatens to close the Strait of Hormuz. But the more fundamental reason for high oil prices over the last few years has been the decline of the Dollar. After all, the Iranian threat to oil transportation in the Persian Gulf has only recently resurfaced.

But some say that the US does not rely on imports of Iranian oil. Well, we do feel the effect of the Iranian war premium. Oil is traded in the global market, and oil is fungible. That is, a barrel of oil from Saudi Arabia can be substituted for barrel of similar quality oil from Iran or Venezuela at the same market price. Because the US is a net importer of oil, we pay the global price. Unfortunately we are likely to be a net importer for some decades yet.
           
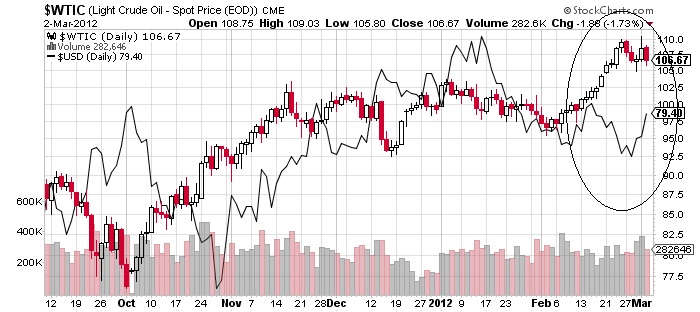
We can see the inverse relationship of oil (WTI) to the value of the Dollar in the chart below.


WTI has jumped from $95 bbl to over $110 bbl as the Dollar dipped from 82 to 78. Gasoline prices have jumped in turn, to over $4.00/ gal in some states. Higher energy and transportation costs eventually find their way into the prices of most consumer products, acting as a tax on the consumer. This causes many consumers to pull in their horns and puts a damper on consumer demand which slows economic activity. Higher oil and gasoline prices are additional examples of the unintended consequences of the Fed’s ultra-accommodative monetary policy.

Stealthy QE3 would pump up the stock market, particularly bank stocks. But QE3 would also mean higher prices in general. QE3 would further debase the Dollar and reduce purchasing power. QE3 means more inflation. QE3 means there is more reason to guard against inflation and artificially inflated assets. QE3 means higher gold and silver prices. To the prudent investor, QE3 means buy more gold and silver. The way to preserve wealth is to own and hold sound money.

Investors from around the world benefit from timely market analysis on gold and silver and portfolio recommendations contained in The Gold Speculator investment newsletter, which is based on the principles of free markets, private property, sound money and Austrian School economics.

The question for you to consider is how are you going to protect yourself from the vagaries of the fiat money and economic uncertainty?  We publish The Gold Speculator to help people make better decisions about their money. Our Model Conservative Portfolio has outperformed the DJIA and the S&P 500 by more than 3:1 over the last several years.   Subscribe at our web site www.thegoldspeculatorllc.com  with credit card or PayPal ($300/yr) or by sending your check for $290 ($10 cash discount) The Gold Speculator, 614 Nashua St. #142 Milford, NH 03055

Fiat Empire; Why the Federal Reserve Violates the U.S

Barney Frank DNK Freddie/Fannie

The Fall of the Republic