By
Scott Silva

Editor,
The
Gold Speculator
2-22-12
The
charts are displaying new strength in gold and silver. We will see new highs in
gold and silver this year. It’s not too late to buy the precious metals at
bargain prices.
Technical
analysis is a powerful tool for understanding the market for a traded good.
Technical analysis employs time-tested techniques for predicting future price
levels. The successful technical trader uses a combination of indicators to
support the decision to take a long or short position in a given commodity. The
planets are lining up in favor of another leg up in gold and silver. Let’s
examine what the charts are telling us about gold today.
First,
gold has broken out of a bullish falling wedge chart pattern dating back to
September 2011.
The
falling wedge pattern can be a continuation or a reversal pattern. It this
case, it is a reversal pattern, signaling a reversal of an intermediate bearish
trend. The falling wedge is a bullish pattern that begins wide at the top and
narrows as prices gradually move lower. This price action forms an extended
cone shape that slopes down as the reaction highs and reaction lows converge.
The pattern is defined by the down-sloping upper resistance line and the lower,
converging base support line. The
bullish breakout occurs when price action closes above the resistance line
(upper descending tend line) with confirming volume. The point count for the
pattern is calculated by adding the magnitude at the widest span to the price
at breakout.

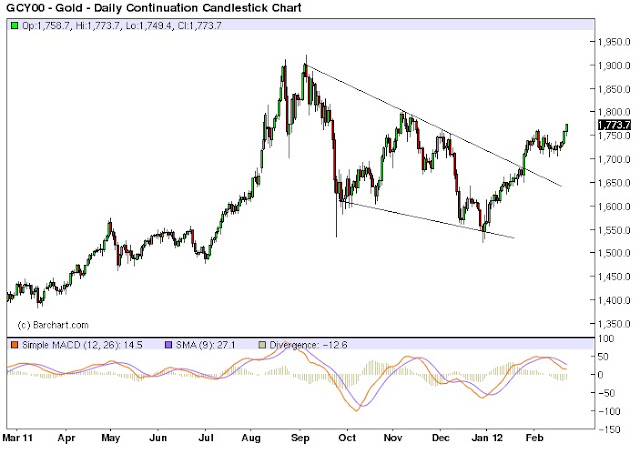
We
can see the falling wedge reversal pattern in the daily basis chart for April
COMEX gold above. The intermediate bearish trend began in early September 2011.
The price at the break above the resistance line was 1674.40. The point count is 321 which sets the price
target at $1995/oz. The breakout is
confirmed by significant volume at the breakout day, January 25th.
We
can see the same breakout in gold using Ichimoku Kinko Hyo indicators.

Here
we see spot gold on a daily basis with Ichimoku indicators. The January 25
breakout above resistance on higher volume is highlighted in the oval. Today’s
chart shows all Ichimoku indicators are bullish for gold. Price action is above
the cloud, which is bullish. The Tenkan Sen made a bullish cross (from below)
the Kijun Sen back on January 17th. The projected cloud is bullish
(shaded green). And the Chikou Span is
well above price action and above the cloud, which is a strong bullish signal.
Silver
is displaying similar bullish patterns and indicators. So are selected gold and
silver stocks.
Now
is the time to own gold and silver.
Investors from around the
world benefit from timely market analysis on gold and silver and portfolio
recommendations contained in The Gold
Speculator investment newsletter, which is based on the principles of free
markets, private property, sound money and Austrian School economics.
The
question for you to consider is how are you going to protect yourself from the
vagaries of the fiat money and growing inflation? We publish The Gold Speculator to help people make better decisions about
their money. Our Model Conservative Portfolio has outperformed the Dow and the
S&P 500 by more than 3:1. Subscribe at our web site www.thegoldspeculatorllc.com with credit card or PayPal ($300/yr) or by
sending your check for $290 ($10 cash discount) The Gold Speculator, 614 Nashua
St. #142 Milford, NH 03055
No comments:
Post a Comment